metrics-data-tiles
Overview
The Flex Real Time Queues view provides a few standard Data Tiles that aggregate the queue data at the contact center level:
- Agents: Bar chart with the number of available, unavailable, and offline agents.
- Active Tasks: The number of tasks that are currently being handled.
- Waiting Tasks: The number of tasks that are waiting to be handled.
- Longest Wait: The amount of time in seconds for the longest waiting task.
These Data Tiles are contained within the AggregatedDataTiles component at the top of the Queues View page.
As you can see from this example in our Flex documentation, you can add custom DataTiles to display custom metrics and KPIs.
Having additional Data Tiles available with useful aggregated metrics or KPIs (by channel) gives the contact center supervisor better visibility into the traffic levels, task routing & handling efficiency and agent performance. Using tiles with color-coded backgrounds provide better visual cues and improves the overall UI.
You can connect a custom Data Tile to the Flex Redux application store using connect from React-Redux. You need to provide the equivalent of a mapStateToProps function and return an object with props. Alternatively, in Flex v2 you can now leverage the useFlexSelector wrapper method to extract the real time queues data from the Flex Redux store for use in a React component.
The Flex Teams View does not natively support Data Tiles or any kind of worker (or task) metrics and aggregations, but you can customize the Teams View and add a Tiles section at the top of the page for this purpose.
How does it work?
As outlined in this blog post, the Real Time queues data in the Flex Redux store can be aggregated into channel specific metrics, which can subsequently be rendered in a custom data tile. These Data Tiles are added to the AggregatedDataTiles component of the Queues Stats View.
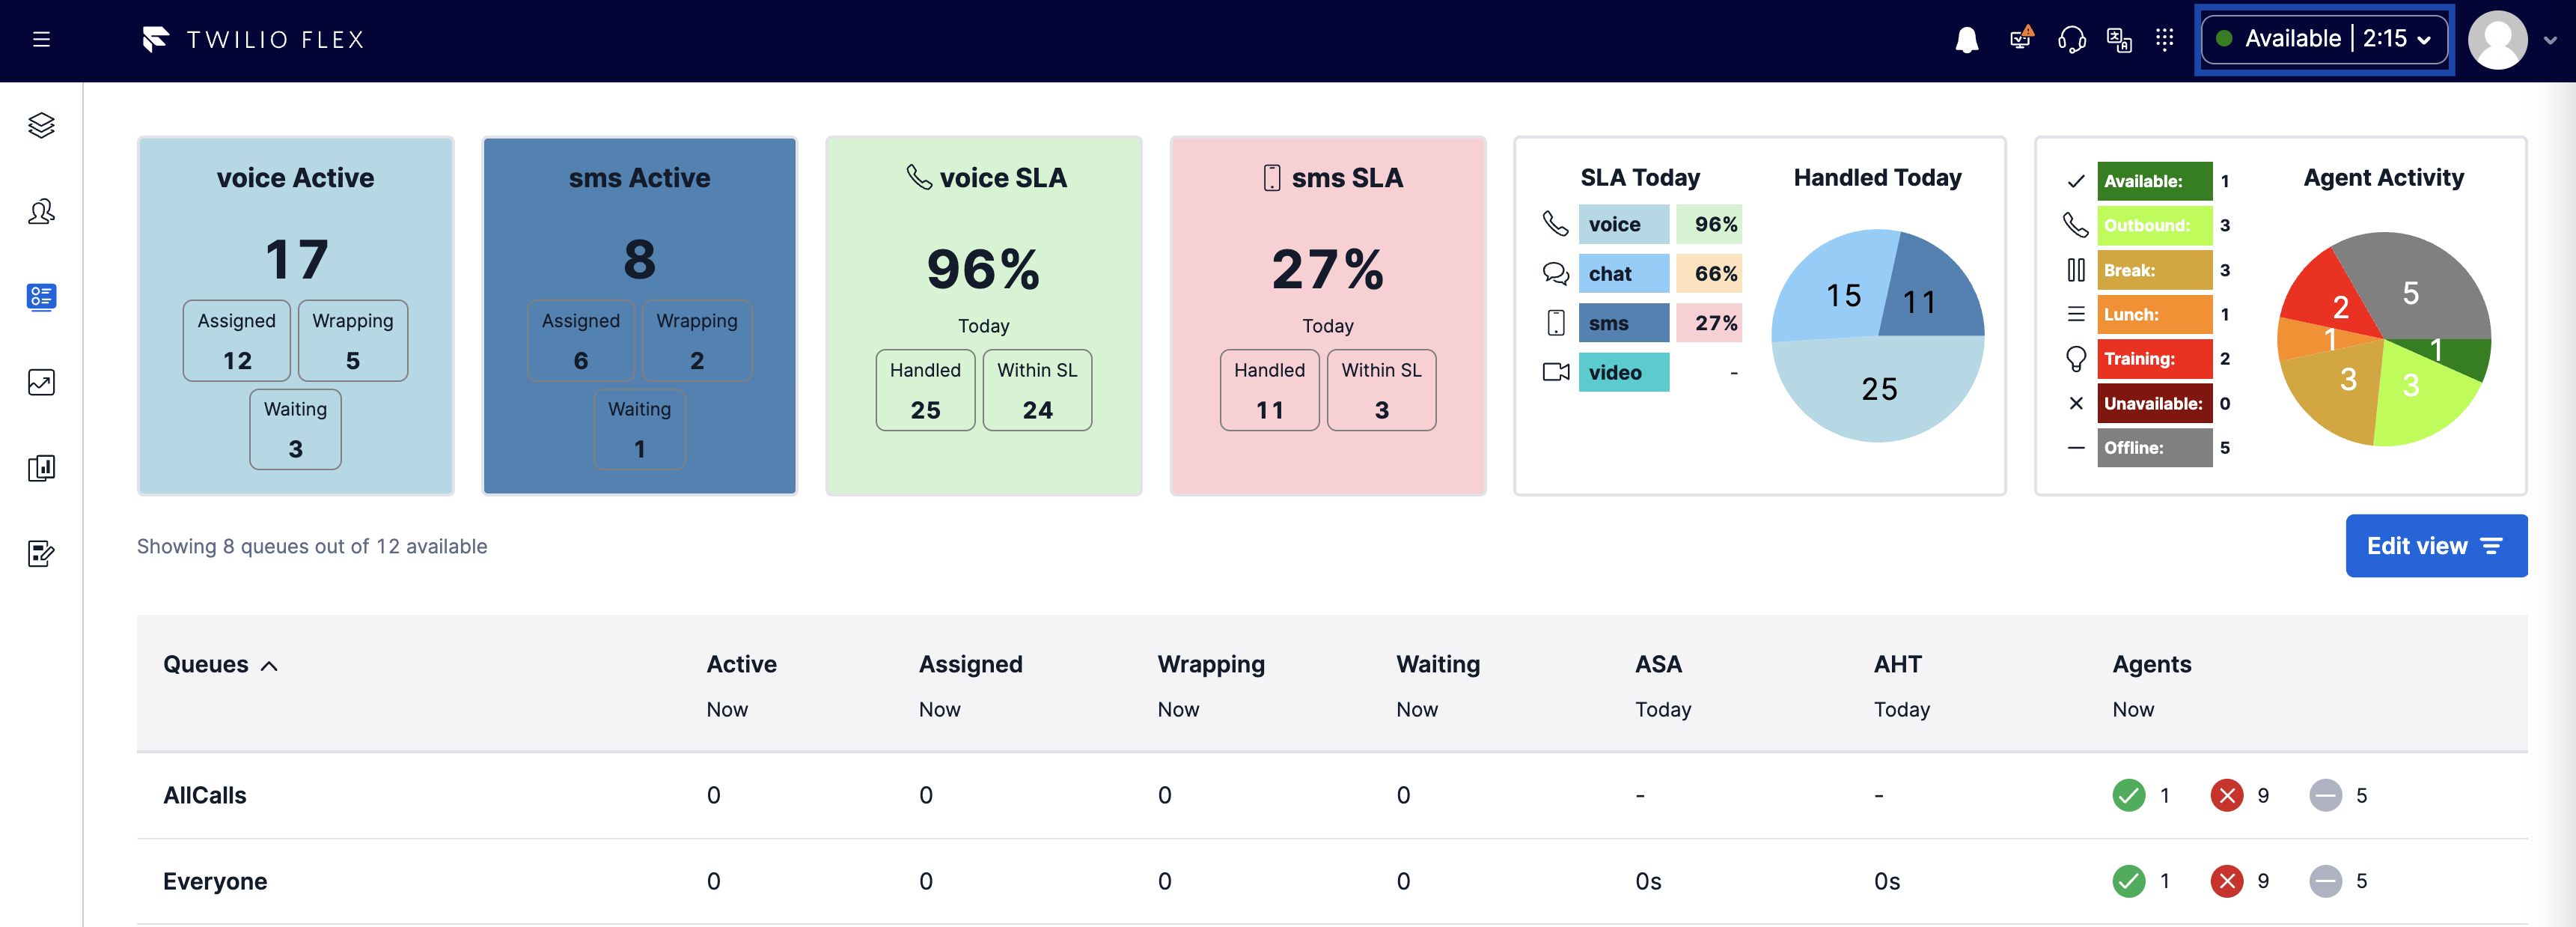
This feature includes 4 different data tiles for the Queues View:
Channel Task Counts Data Tiles
The Channel Task Counts Data Tile displays the Active and Waiting Tasks for a specific Task Channel (e.g voice, chat, sms, video). The Active task count is the sum of Assigned Tasks and Wrapping Tasks which are displayed separately as well. For Voice Tasks, the number of Assigned Tasks should be equivalent to the number of agents talking.
Channel SLA Data Tiles
The Channel SLA Data tile displays the Service Level % for all tasks associated with a specific Task Channel.
The Service Level % is calculated as follows:
SL Pct = Handled Tasks within Service Level / Handled Tasks
The background color of the Channel SLA Tile changes based on the Service Level % value. Service Level values >= 90 are rendered with a green background, values between 61 and 90 are shown with a yellow background and values <= 60 are displayed with a red background. These levels can be customized as needed.
All Channels SLA Tile
This data tile combines the Service Level % for all configured channels with a Pie Chart to display a breakdown of all Handled Tasks for Today. When this combination Data Tile is enabled, you may not need to enable the individual Channel SLA tiles.
Enhanced Agent Activity Tile
The native Agent Activity Bar Chart adds up all Unavailable activities into 1 category (Unavailable) and does not show the agent counts for each specific Unavailable activity (for example, Break, Training, Lunch etc). The Workspace agent activity data can be aggregated by Activity to display this more granular breakdown. For any worker activity that is not explicitly configured with a color & icon, the worker count will be combined under the OTHER category. Due to the limited space in the Data Tiles section, we suggest you configure no more than 6 or 7 Activities to highlight in this tile (and use the OTHER category for all other unavailable activities).
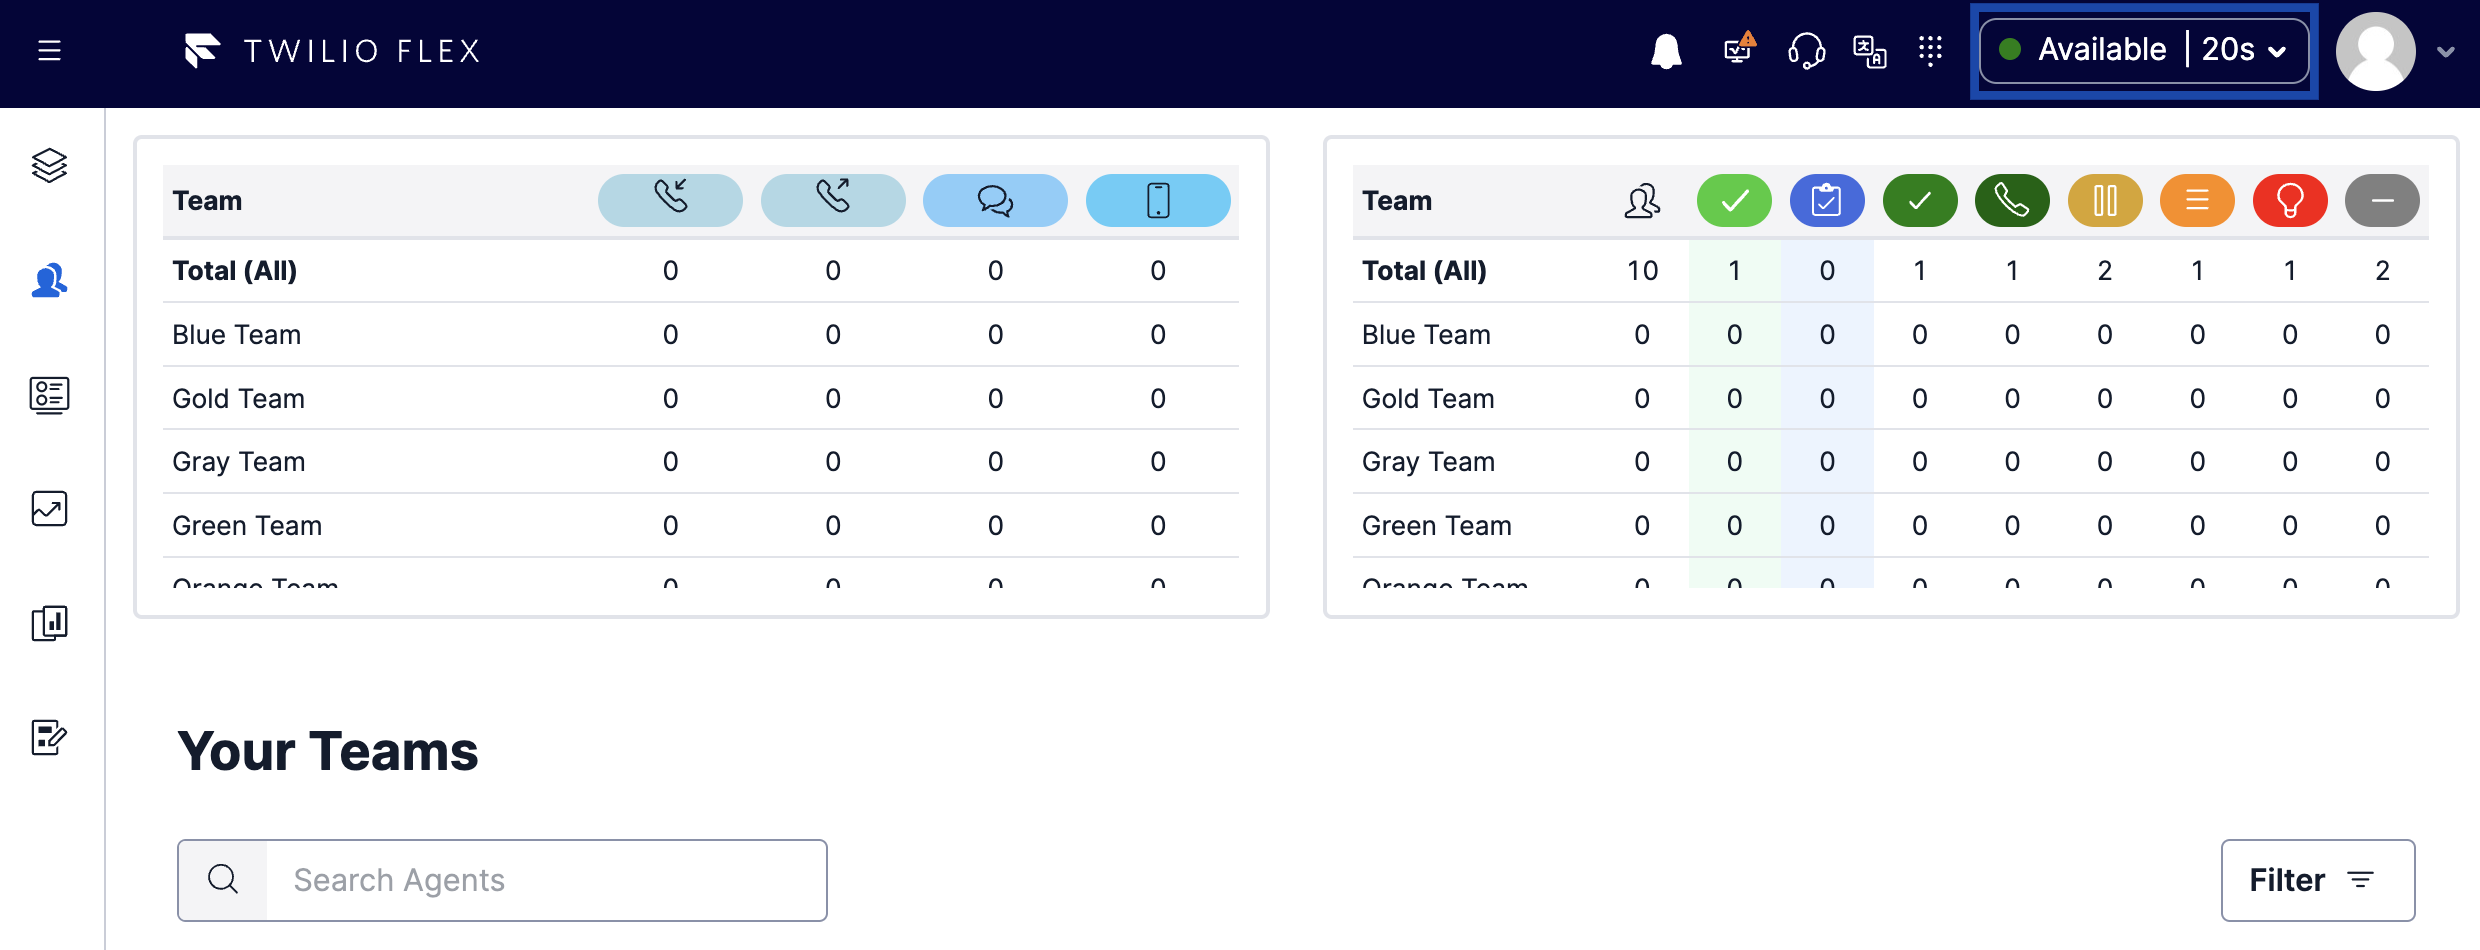
Teams View Data Tiles
Also included in this feature are custom Data Tiles for the Teams View since these share the configuration settings for channels and activities with the Queues View Data Tiles.
The Worker and Task data available in Redux for the Teams View can be aggregated by team_name attribute (if populated for all workers) and summarized in "Data Tiles" at the top of the page, similar to the Queues View.
The Task Summary table provides a breakdown of all active tasks by Channel (Voice, Chat, SMS) and agent team. For the Voice channel the active call count is split into Inbound and Outbound calls.
The Agent Activity Summary table shows the count of agents in each of the pre-configured activities by agent team. Two additional columns are provided for Active Agents. The "Idle" column shows the number of Available agents with No Tasks. The "Busy" column shows the number of Available agents with at least one Task.
This feature uses the list of Team names as configured in the common configuration settings.
Setup
This feature can be enabled via the flex-config attributes. Just set the metrics_data_tiles enabled flag to true and set up the desired configuration.
-
To enable specific data tiles on the Real-time Queues View set the appropriate tile to
true -
You can change the Channel colors as needed.
-
The Enhanced Agent Activity tile replaces the native Bar Chart so if you enable it you can disable the Bar Chart on Flex UI 2.8 or later by setting
"agents_by_activity_bar_chart": false. -
The native All Channels tile may be redundant with the other tiles enabled, so you may disable this on Flex UI 2.8 or later by setting
"all_channels_data_tile": false. -
Configure activities to match the names of the Activities as defined in TaskRouter. The Flex UI includes a set of icons that are used to enhance the display of the individual activities.
-
You can also enable the Task Summary tile (on the Teams View) to show a breakdown of the active tasks counts by Channel and Team. Select which channels to display by setting
teams_task_summary: true. -
When enabling the Team Activity data tile, also configure the activity names to match the TaskRouter Activities in your workspace.
Note: The Teams View can only display up to 200 agents, so the worker data available for aggregation is limited to this data set.
     "metrics_data_tiles": {
        "enabled": false,
        "queues_view_tiles": {
          "all_channels_data_tile": true,
          "all_channels_sla_data_tile": false,
          "agents_by_activity_bar_chart": true,
          "enhanced_agent_by_activity_pie_chart": false
        },
        "teams_view_tiles": {
          "task_summary_tile": false,
          "team_activity_tile": false,
          "status_idle_color": "limegreen",
          "status_busy_color": "royalblue",
          "status_idle_name": "Available"
        },
        "channels": {
          "Voice": {
            "color": "#ADD8E6",
            "SLA_data_tile": true,
            "task_counts_data_tile": true,
            "teams_task_summary": true
          },
          "Chat": {
            "color": "#87CEFA",
            "SLA_data_tile": true,
            "task_counts_data_tile": true,
            "teams_task_summary": true
          },
          "SMS": {
            "color": "#59cef8",
            "SLA_data_tile": false,
            "task_counts_data_tile": false,
            "teams_task_summary": true
          },
          "Video": {
            "color": "#00CED1",
            "SLA_data_tile": false,
            "task_counts_data_tile": false,
            "teams_task_summary": false
          }
        },
        "agent_activity_configuration": {
          "activities": {
            "Available": {
              "color": "green",
              "icon": "Accept"
            },
            "Outbound": {
              "color": "darkgreen",
              "icon": "Call"
            },
            "Break": {
              "color": "goldenrod",
              "icon": "Hold"
            },
            "Lunch": {
              "color": "darkorange",
              "icon": "Hamburger"
            },
            "Training": {
              "color": "red",
              "icon": "Bulb"
            },
            "Offline": {
              "color": "grey",
              "icon": "Minus"
            }
          },
          "other": {
            "color": "darkred",
            "icon": "More"
          }
        }
      },
Flex User Experience
When enabled, the Task Summary and Team Activity Tiles are added to the top of the Teams View.